What Is Variance Analysis?
Every business sets targets for revenue, costs, and production. But shifts in internal and external factors can affect whether it achieves these targets. Variance analysis is a tool that identifies the difference between achieved results and forecasted budgets and determines the root cause of the variance.
In this article, we’ll look at variance analysis, its types, and how you can successfully conduct it.
Key Takeaways
- Variance analysis is the process of calculating differences between actual revenue or cost figures and their budgeted forecast, and identifying the cause of variance.
- Variance analysis helps improve decision-making, enhance forecast accuracy, and identify discrepancies in data.
- Variance analysis can be conducted for revenue, costs, material, labor, and fixed overhead cost.
- Using outdated budgets or benchmarks for comparison, ignoring interdependence of variances, and disregarding small variances can skew business performance results.
What Is Variance Analysis?
Variance analysis is the process of calculating the variance between forecasted costs or revenue and the actual figures, while identifying the reasons for it. It helps assess an organization's financial performance relative to the benchmark and guides subsequent decisions.
Variance analysis can be for different business variables revenue, labor, material, etc., but there is a relatively simple formula to measure variance:
Variance = Actual Result - Budgeted Result
The resulting variance can be considered favorable or unfavorable depending on the aspect of the business we are examining and its impact on profitability.
Why does Variance Analysis Matter?
Variance analysis is often performed at month-end closing and gives insights into business performance. Here’s why it matters:
1. Improve Decision Making
Variance analysis provides clarity on areas of variance between actual and predicted budgets. This helps assess the performance drivers and accordingly allocate resources to areas that need improvement.
2. Enhance Forecast Accuracy
Regularly reviewing variance analysis enhances your ability to forecast future performance accurately and build budgets based on requirements.
3. Identify Discrepancies
Variance analysis helps your accounts teams identify errors or anomalies in data that may skew financial statements.
{{banner1}}
What are the Types of Variance Analysis?
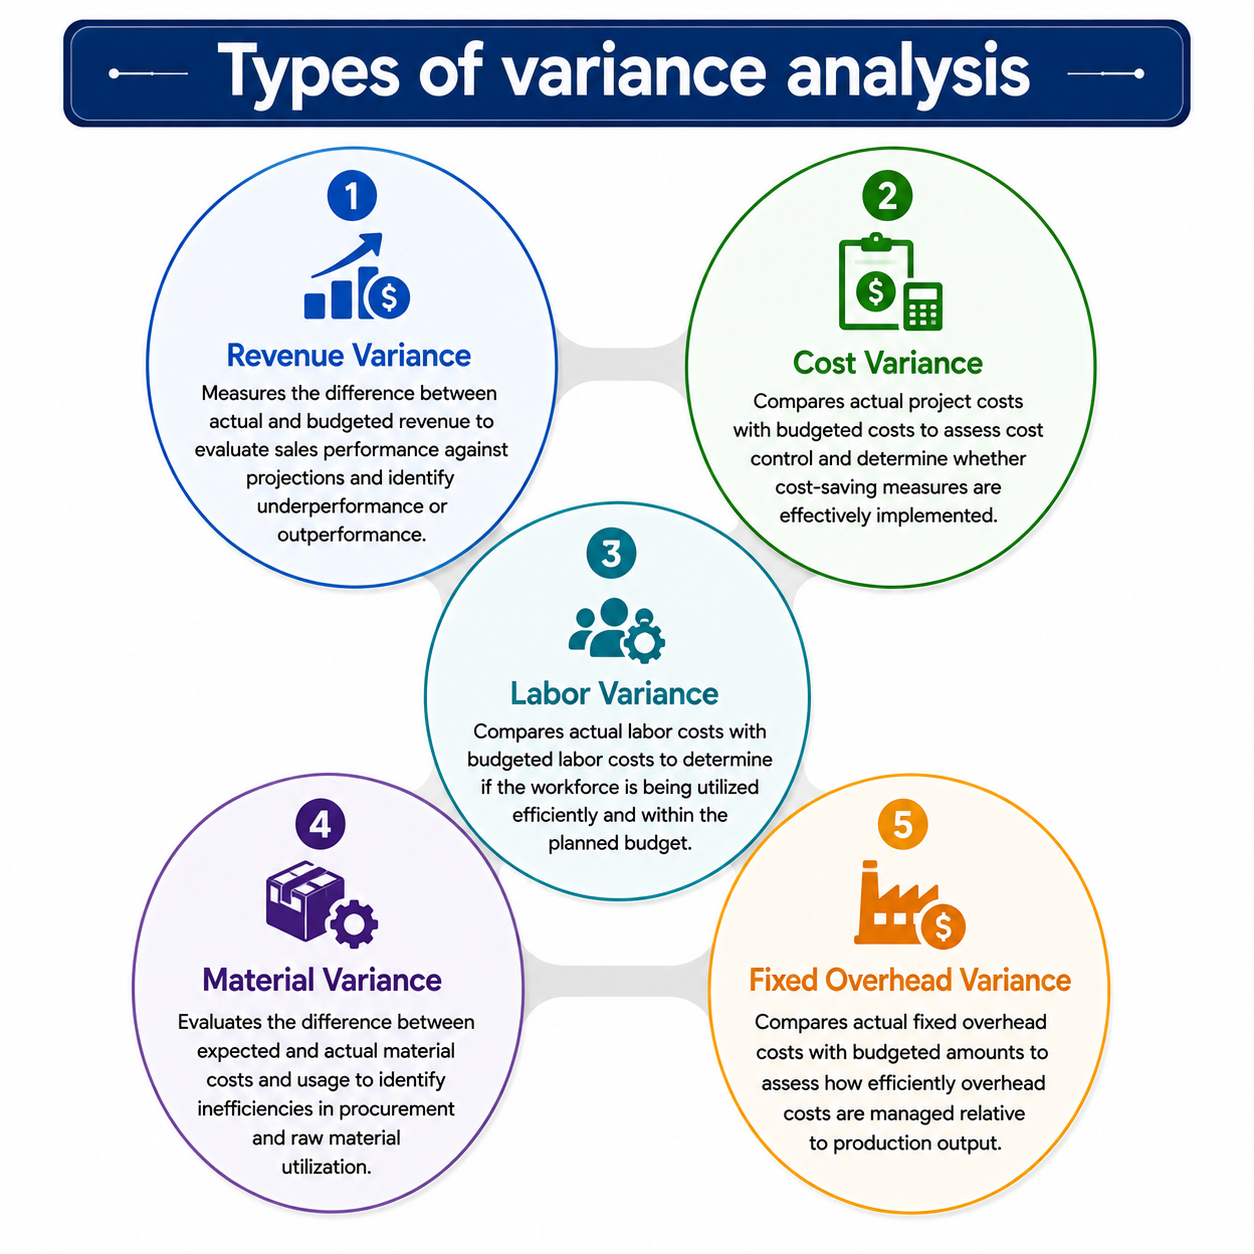
You can run variance analysis across different aspects of your organization, depending on which key performance indicator you’re prioritizing. The following are common types of variance analysis:
1. Revenue Variance
Revenue variance analysis identifies the difference between the actual and predicted revenue for specific periods. It helps understand whether the organization’s sales performance aligns with its projection.
Variance = Actual Revenue - Budgeted Revenue
A positive result indicates the business is selling more than expected, while a negative result points to underperformance.
2. Cost Variance
Cost variance is the difference between budgeted and actual project costs.
Variance = Actual Cost - Budgeted Cost
In cost variance, a negative result is generally considered favorable, as it indicates the organization’s ability to implement cost-saving measures.
3. Labor Variance
Labor variance is a comparison between budgeted labor costs and the costs incurred.
Variance = Budgeted Labor Cost - Actual Labor Costs
A negative result indicates that the workforce is costing more than planned, either due to inefficiency in the task or higher wage rates.
4. Material Variance
Material variance is the difference between the expected cost of raw material and the amount paid. It can be further broken down into material price variance (MPV) and material quantity variance (MQV), which measure the actual use compared to standard quantity.
MPV = Standard material cost - Actual Material Cost
MQV = Standard Material Quantity - Actual Material Quantity
The results help identify inefficiencies in procurement and raw material utilization.
5. Fixed Overhead Variance
Fixed overhead variance is the difference between the budgeted amount for fixed indirect cost and actual costs incurred.
Variance = Incurred Overhead Cost - Budgeted Overhead Cost
The results help determine whether fixed overhead costs are being efficiently managed relative to production output.
Favorable Vs Unfavorable Variances
Variance can be considered either favorable or unfavorable, depending on the type of variance being analyzed and its impact on the organization's profitability. For example, a positive revenue variance is considered favorable, whereas a positive cost variance is unfavorable because production costs exceeded the allotted budget.
However, a favorable variance isn’t always a good sign for the business. For instance, actual costs being below budget may be considered favorable, but if this resulted from lower production due to weak demand, the underlying condition is unfavorable for business profitability.
Variance Analysis Example
Let’s understand variance analysis with an example. Consider a manufacturing company that has budgeted $500,000 in revenue and $300,000 in production costs for the quarter. The actual revenue came in at $510,000 while production costs were $320,000.
Revenue Variance = $510,000 - $500,000 = $10,000
Cost Variance = $300,000 - $320,000 = $-20,000
The revenue variance turned out to be favorable while the cost variance was unfavorable. On further investigation, it was found that raw material prices had increased unexpectedly, raising costs and forcing the company to adjust its pricing, resulting in lower sales volume.
This outcome indicates that although revenue was favorable, higher costs and lower sales volume negatively affected profitability.
How is Variance Analysis Conducted?
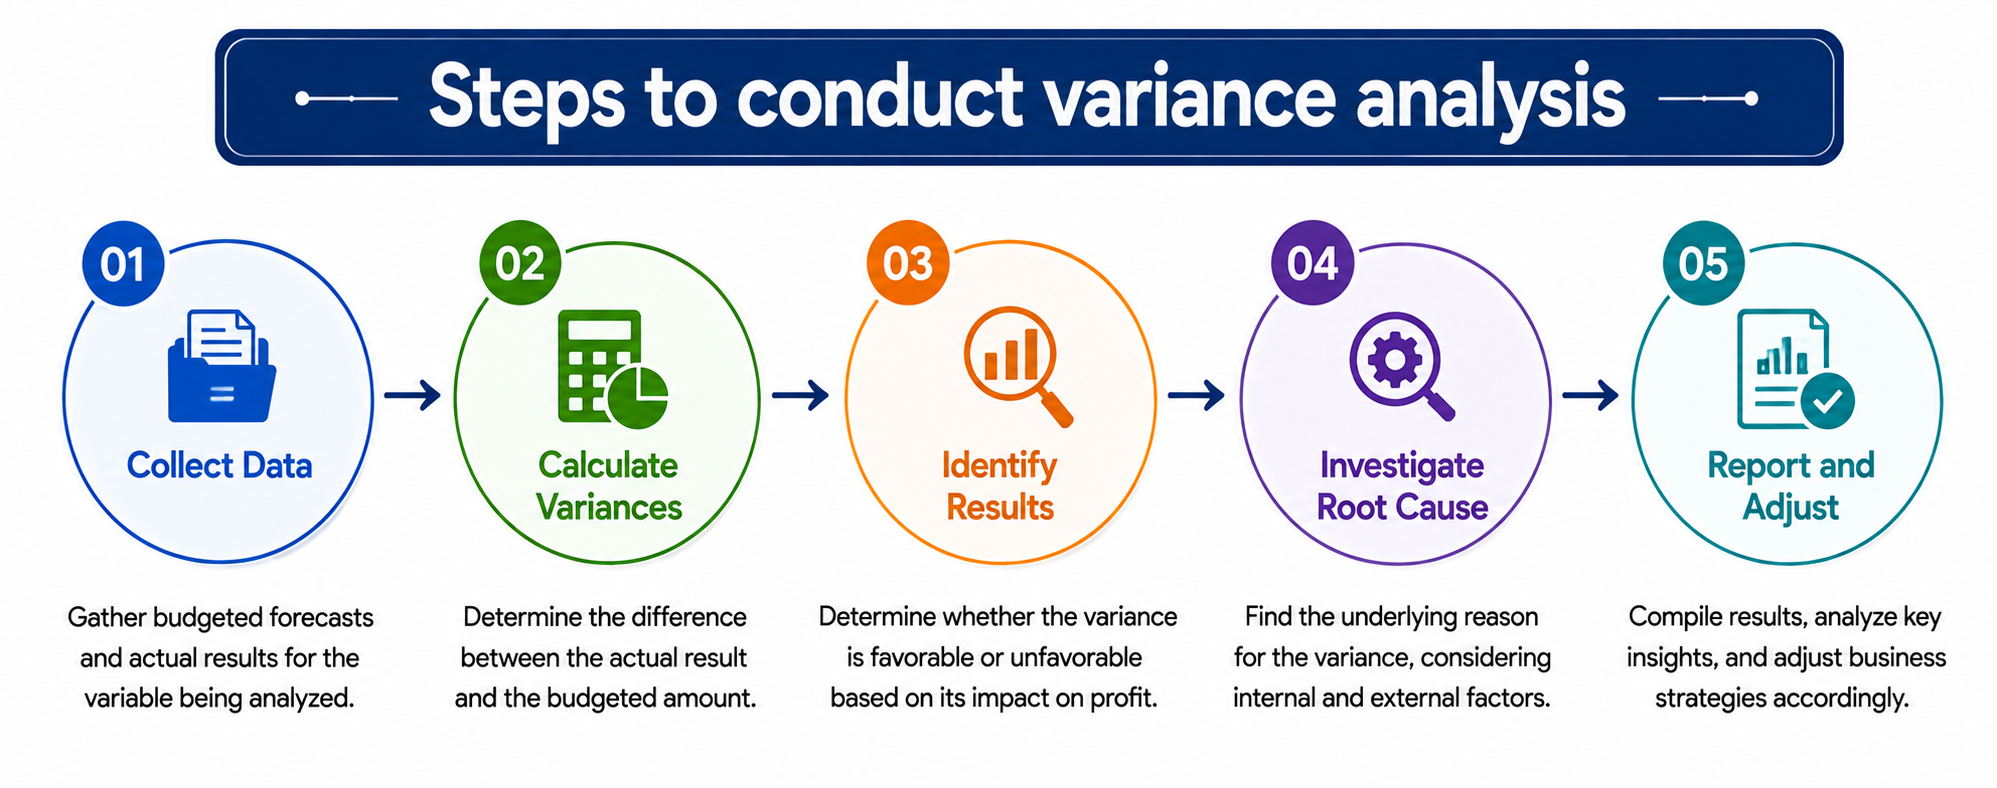
A thorough variance analysis involves multiple steps to highlight the organization’s financial performance clearly.
1. Collect Data
The first step is to compile data on budgeted forecasts and actual results for the variable being analyzed.
2. Calculate Variances
Calculate the variance between the actual result and the budgeted amount.
Variance = Actual Result - Budgeted Amount
3. Identify Results
Identify whether the variance was favorable or unfavorable in terms of profit. For example, a positive revenue variance would be considered favorable, but a positive cost variance would be considered unfavorable.
4. Investigate Root Cause
Identify the cause that resulted in the variance. Consider whether it was an internal factor like a pricing decision or an external factor like a market shift that contributed to the favorable or unfavorable variance.
5. Report and Adjust
Create a report compiling results from all variance analyses, including details on factors affecting the budgeted forecast. Analyze the results carefully and adjust business strategies accordingly.
{{banner1.1}}
What are the Common Mistakes in Variance Analysis?
Variance analysis aims to provide you with information on variables that affect business profitability and to help you adjust your strategy accordingly. However, certain mistakes can result in misleading conclusions.
1. Using the Wrong Budget
The actual results have to be compared with appropriate budgets or past benchmarks. Overestimating your revenue and cost forecasts or relying on outdated benchmarks can lead to variances that do not reflect actual business performance.
2. Ignoring Interdependence of Variance
An underlying change in another factor can always trigger favorable or unfavorable variances in business aspects. For instance, higher revenue than budget can result from reduced raw material costs, which allow the production and sale of more goods.
3. Disregarding Small Variance
A small variance in one quarter may not seem significant. Still, a repeat of this variance across consecutive quarters is a cause for concern, especially when unfavorable, as it can erode business profits.
Wrapping Up
Variance analysis is a non-negotiable tool for financial teams to understand business performance. By comparing actual results with budgeted or historical amounts, you can turn raw numbers into meaningful insights that guide your next business decisions.
However, the accuracy of your financial data is critical to calculating precise budget forecasts and variances. This is where Osfin comes into play.
Osfin is an intelligent automation platform for high-speed reconciliation. It ingests data from multiple sources via its 170+ integrations, applies logic-based matching rules for reconciliation, and flags unmatched transactions through its exception-handling engine.
Moreover, Osfin maintains an audit-ready workflow and keeps your data secure with 256-bit encryption, two-factor authentication and role-based access. Book a demo now!
FAQs
1. What are the types of variance analysis?
Revenue, cost, material, labor, and fixed overhead are common types of variance analysis.
2. What are the steps of conducting variance analysis?
Variance analysis starts by collecting data on actual figures and budget amounts, and calculating the variance between them. Next, determine whether the results are favorable or unfavorable and identify the root cause. Lastly, create a report on variance analysis findings and adjust your business strategy accordingly.
3. What mistakes have to be avoided while running a variance analysis?
Mistakes to avoid while conducting variance analysis include using an outdated budget for comparison, ignoring the interdependence among different types of variance, and disregarding small variances that recur in every analysis.
4. What are the benefits of variance analysis?
Variance analysis helps businesses improve decision-making, enhance forecasting, and identify discrepancies in financial data.